
Calculations on the home page assumed that speakers exhibit a constant impedance throughout their frequency range. Although this simplification is adequate for many purposes, a finer model is sometimes required. The diagram below illustrates the connections of one popular scheme that uses:

A convenient text notation for this wiring is Ser (Par (R1, L1, C1), R2, L2) where Ser stands for series and Par for parallel. In this report, this model is called RLC-RL.
With well-chosen values for the five components, this network can fairly well approximate the impedance behavior of a typical dynamic speaker for guitar, as input varies over the range of audio frequences, 20 Hz to 20 kHz. RLC-RL is most accurate when the speaker is not mounted in any cabinet or on any baffle — the "free air" condition. In practice however, speakers need to be in cabinets for two reasons: (1) to protect the speaker from damage, and (2) to prevent a low-frequency wave originating from the back of the speaker from circling around and cancelling the opposite-phase wave originating from the front of the speaker. For precise modeling of the effects of a cabinet, a model more sophisticated than RLC-RL is required; among other reasons, the enclosure has a resonant frequency depending on its volume.
Some manufacturers publish charts showing how impedance of their speakers varies with frequency, for instance:
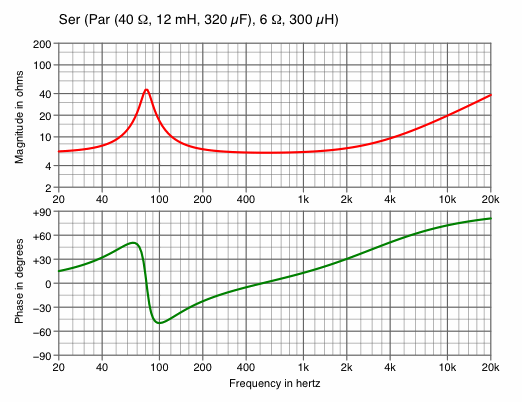
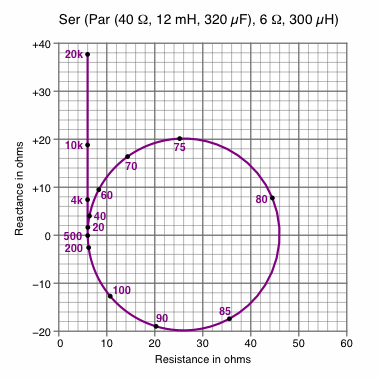
Such charts routinely include the magnitude of the complex impedance, but not the phase. It turns out that for dynamic speakers, the phase is roughly proportional to the derivative [w] of the magnitude, so at least the phase can be estimated. The phase of a dynamic speaker might lie anywhere between −90° and +90°, but amplifiers usually perform best when the phase is between −45° and +45°. Otherwise, the amplifier can be delivering substantial voltage and current, yet little power.The network Ser (Par (40 Ω, 12 mH, 320 μF), 6 Ω, 300 μH) was selected as a benchmark for comparison within this report because it approximates the electrical characteristics of a typical guitar speaker. Its impedance curves are displayed three different ways in charts 1A, 1B and 1C.
Chart 1A contains two graphs pertaining to the impedance of the benchmark: in the upper a red curve for the magnitude, and in the lower a green curve for the phase.
| Chart 1A |
|
Magnitude is scaled logarithmically in chart 1A, as is the industry custom, although linear scaling is a practicable option. On the other hand, there is little choice but linear scaling for the phase, because it can be positive, zero or negative.
Chart 1B represents the same information in a completely different format. The purple curve represents the impedance of the benchmark speaker at various frequences, some labeled. Noteworthy is that between 20 Hz and 500 Hz the plot is almost a circle, while above 500 Hz it is almost a straight line.
| Chart 1B |
|
Chart 1C contains the same information as charts 1A and 1B but in a lesser-used arrangement: it displays, on linear scales of ohms, the real part of impedance in blue and the imaginary part in brown.
| Chart 1C |

|
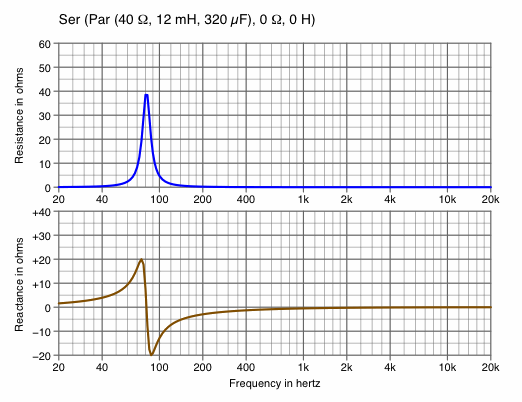
With R1, L1 and C1 set to their benchmark values, they have nearly all of their effect below 400 Hz. This is disclosed in chart 1D, where R2 and L2 have been zeroed.
| Chart 1D |
|
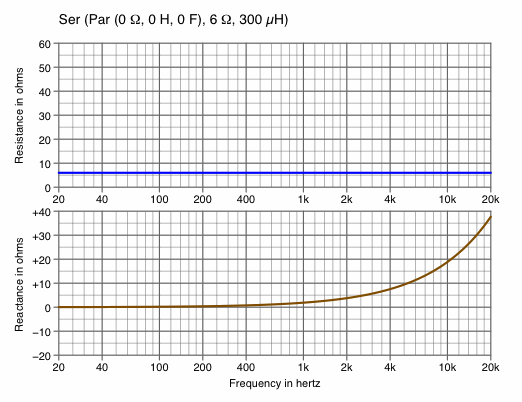
Chart 1E shows that the effect of R2 is constant throughout the whole range of frequencies (blue curve), and L2 has little influence below 400 Hz (brown curve). For this chart, R1, L1 and C1 have been zeroed.
| Chart 1E |
|
Most dynamic speakers have impedance curves that allow the separation of roles illustrated in charts 1D and 1E, although the exact numbers will vary.
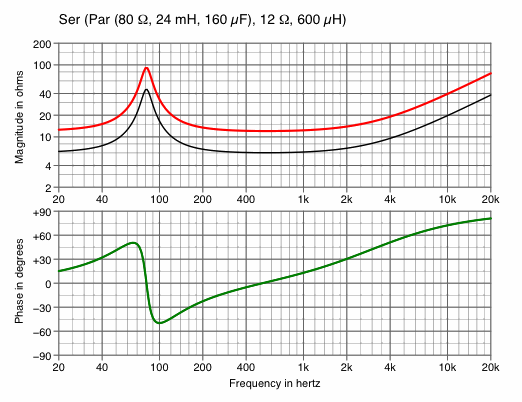
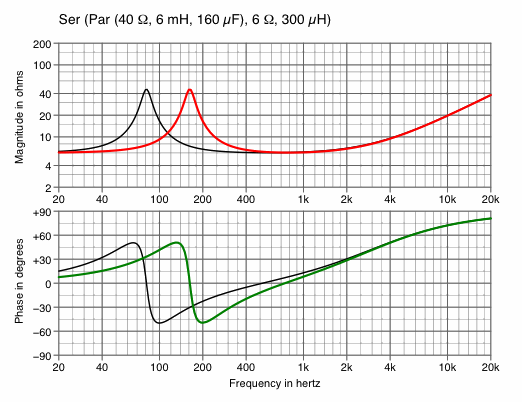
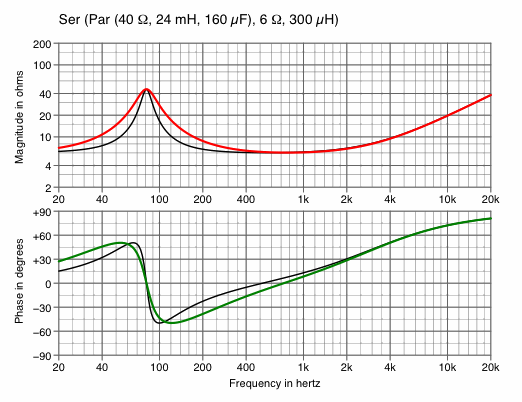
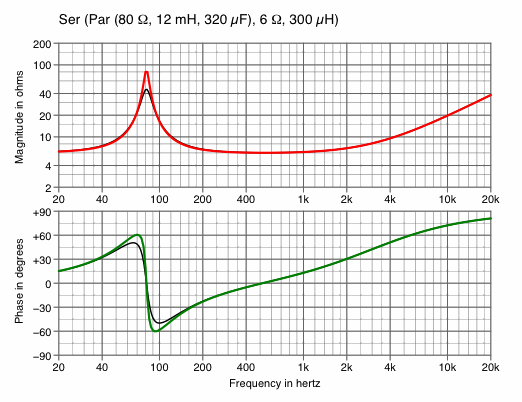
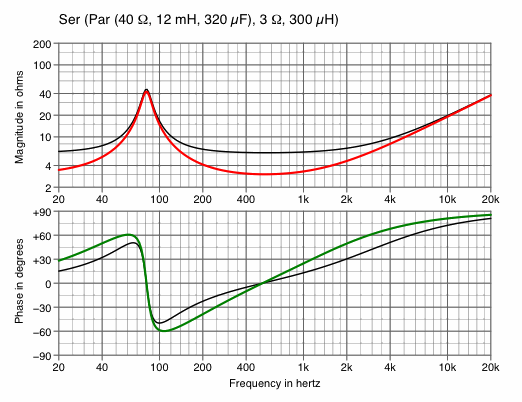
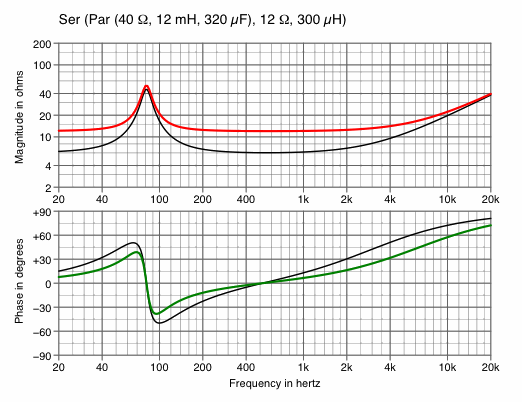
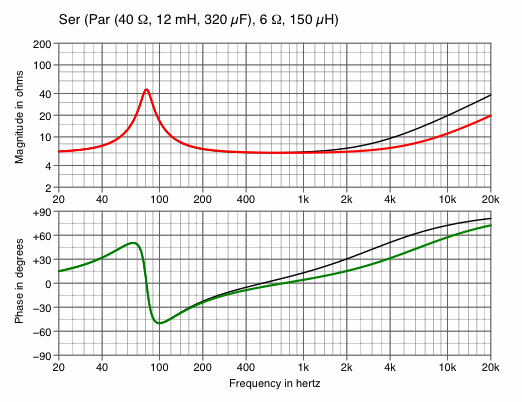
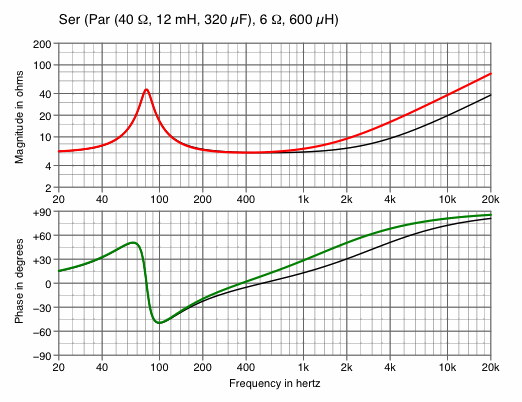
Charts 2 through 7 double and halve the values of various components to illustrate how the impedance curve can be adjusted to more closely match laboratory measurements of a real-world speaker. The ratio 2.0 was selected merely because it yields convenient examples; any other nonnegative real number is also eligible.
Drawn for comparison are black curves representing the magnitude or phase of the impedance of the benchmark speaker (chart 1A). When lying at the same ordinate as the red or green curves, the black curves will be eclipsed.
| Scale the overall impedance | |
|---|---|
| Chart 2A
double C1 and halve all other components — to decrease impedance | Chart 2B
halve C1 and double all other components — to increase impedance |
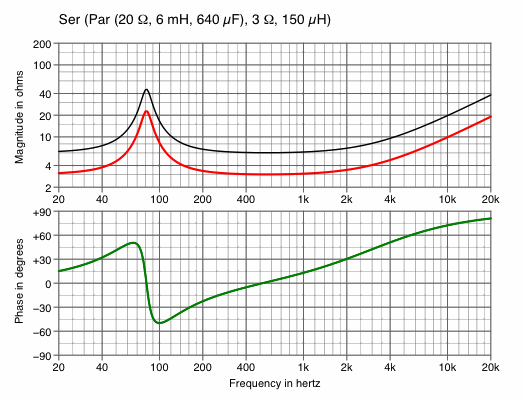
| 
|
| Change frequency of primary resonance | |
|---|---|
| Chart 3A
double L1 and C1 — to decrease frequency | Chart 3B
halve L1 and C1 — to increase frequency |
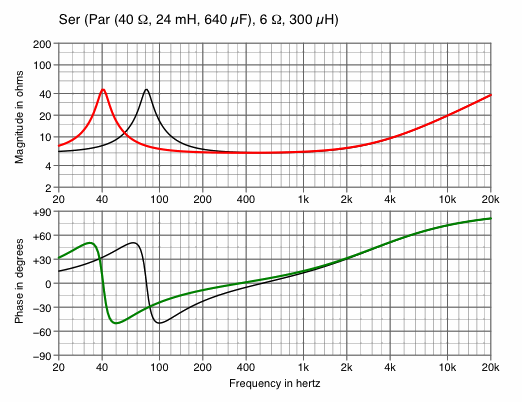
| 
|
| Change bandwidth at primary resonance | |
|---|---|
| Chart 4A
halve L1 and double C1 — to decrease bandwidth | Chart 4B
double L1 and halve C1 — to increase bandwidth |
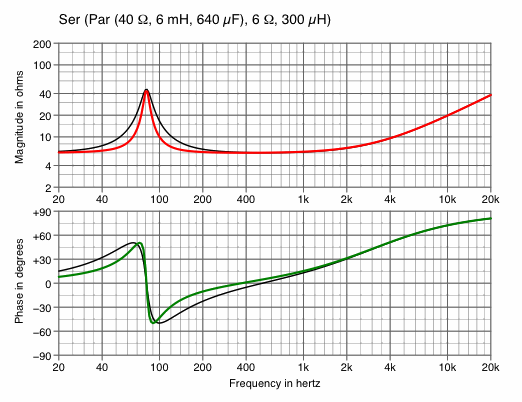
| 
|
| Change peak impedance at primary resonance | |
|---|---|
| Chart 5A
halve R1 — to decrease impedance | Chart 5B
double R1 — to increase impedance |
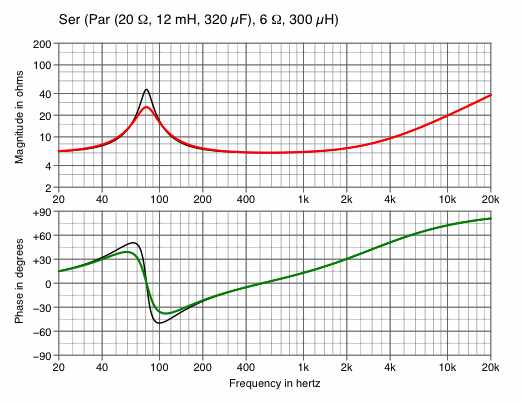
| 
|
| Change minimum impedance | |
|---|---|
| Chart 6A
halve R2 — to decrease impedance | Chart 6B
double R2 — to increase impedance |
| 
|
| Change high-end impedance | |
|---|---|
| Chart 7A
halve L2 — to decrease impedance | Chart 7B
double L2 — to increase impedance |
| 
|
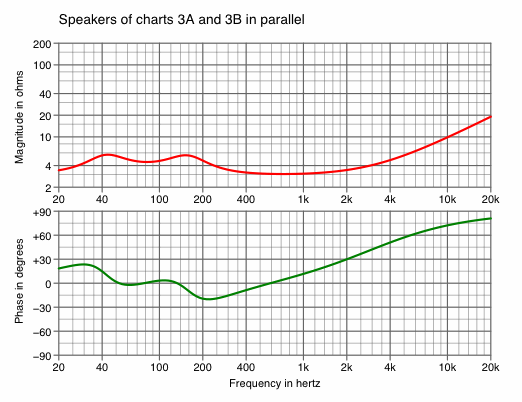
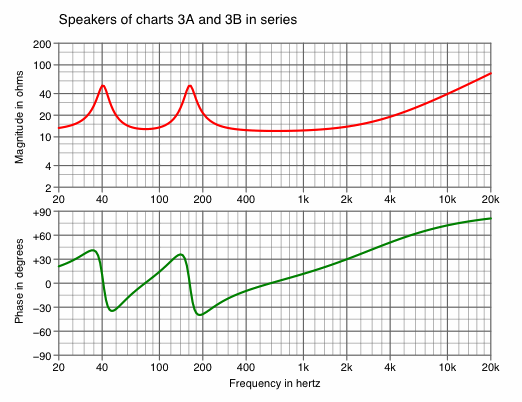
If two identical benchmark speakers are wired in parallel, the impedance curve will be the same as in chart 2A; in series, 2B. More interesting, however, is when two unequal speakers are connected, as in the example of charts 8A and 8B.
| Chart 8A | Chart 8B |
| 
|
Chart 8A displays how the parallel connection largely eliminates any impedance spike at primary resonance, and reduces the phase angle in that region of frequencies. This results in a load that may be easier for an amplifier to drive. Still, caution must be observed with power handling, because at 40Hz speaker 3A presents an impedance magnitude of about 40 Ω and speaker 3B presents only about 6 Ω. Thus at this frequency 13% of current passes through speaker 3A, and 87% of current passes through speaker 3B. A similar phonomemnon occurs at 160 Hz. With such uneven distribution of current, hence power, the overall power handling is little more than that of one speaker.
Chart 8B shows how series connection preserves both of the spikes, giving a clue how to model a speaker with more than one resonance peak — regard it as two RLC-RL speakers in series. Although multiple peaks are not common with guitar speakers, they are more likely with midrange and tweeter devices.
Recall these specifications from: